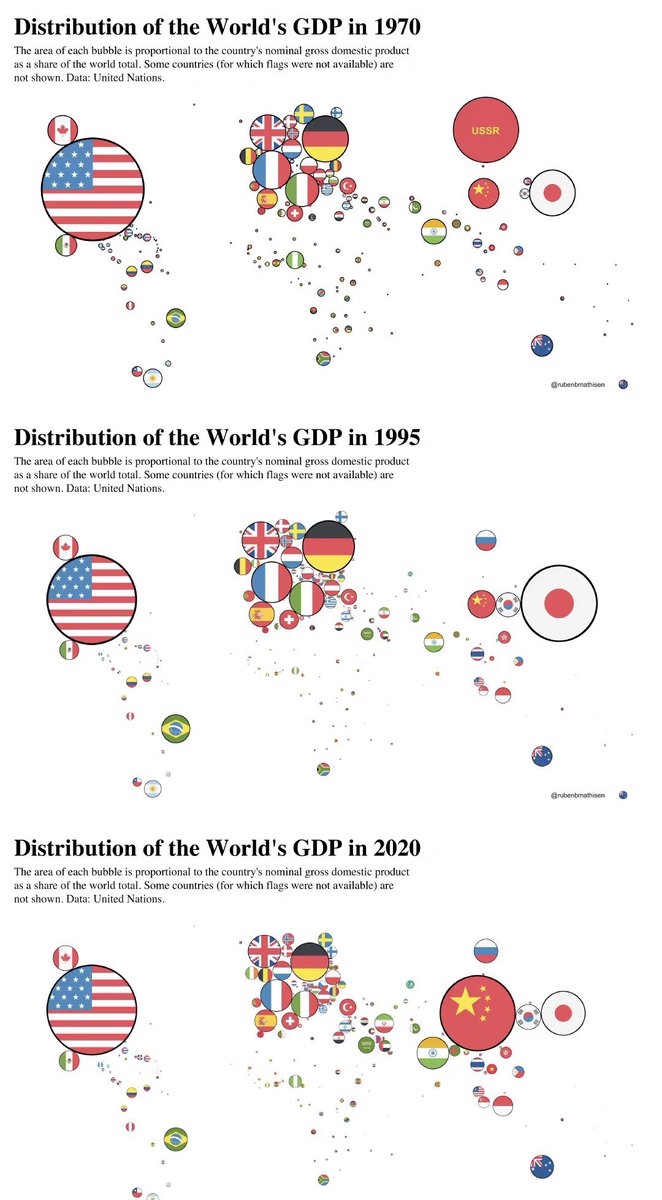
World economic map (1970, 1995, 2020), calculated by GDP. In 1970, the Soviet Union became the second largest economy in the world (12.7%), and China was only the eighth largest (2.7%); in 2020, China became the second largest (17.3%), Russia after the disintegration of the Soviet Union fell out of the top ten, and China's 20-year prosperous economy The achievement is the money earned from the European, American and Japanese markets. China has a trade surplus of US$475 billion from the single US market in one year. Generally, it is 2000 to 300 billion US dollars. Russia's total trade volume in 2021 is only 149.6 billion US dollars. China needs to earn a lot of foreign exchange from the European and American markets to buy chips (nearly 400 billion US dollars in 2022) and 350 billion US dollars of energy.

|